Multi-Task Test#
At first we have to install the newest version of fvGP
##First, install the newest version of fvgp
#!pip install fvgp~=4.8.0
#!pip install plotly
#pip install --upgrade kaleido
Setup#
import numpy as np
import matplotlib.pyplot as plt
from fvgp import GP
import plotly.graph_objects as go
from itertools import product
import plotly.io as pio
pio.renderers.default = "png"
%load_ext autoreload
%autoreload 2
Simple 1d Example#
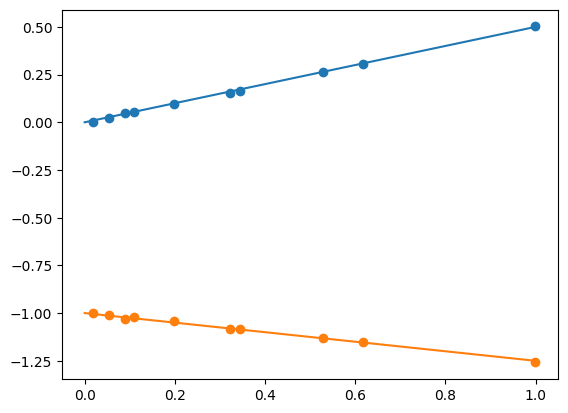
Data#
def f1(x): return 0.5 * x
def f2(x): return (-.25 * x) - 1.

x_pred1d = np.linspace(0,1,50)
plt.plot(x_pred1d,f1(x_pred1d))
plt.plot(x_pred1d,f2(x_pred1d))
x_data = np.random.rand(10)
y_data1 = f1(x_data) + np.random.uniform(low = -0.01, high = 0.01, size =len(x_data))
y_data2 = f2(x_data) + np.random.uniform(low = -0.01, high = 0.01, size =len(x_data))
plt.scatter(x_data,y_data1)
plt.scatter(x_data,y_data2)
plt.show()
GP initialization#
from fvgp import fvGP

my_gp2 = fvGP(x_data.reshape(len(x_data),1), np.column_stack([y_data1, y_data2]))
print("Global Training in progress")
my_gp2.train(max_iter = 20, info=True)
Global Training in progress
Starting likelihood. f(x)=  26.615113568753735
Finished  10  out of  20  iterations. f(x)=  41.22868213872884
/home/marcus/Coding/fvGP/fvgp/gp.py:303: UserWarning: Hyperparameters initialized to a vector of ones.
  warnings.warn("Hyperparameters initialized to a vector of ones.")
/home/marcus/Coding/fvGP/fvgp/gp.py:337: UserWarning: No noise function or measurement noise provided. Noise variances will be set to (0.01 * mean(|y_data|))^2.
  self.likelihood = GPlikelihood(self.data,
/home/marcus/Coding/fvGP/fvgp/gp.py:665: UserWarning: Default hyperparameter_bounds initialized because none were provided. This will fail for custom kernel, mean, or noise functions
  warnings.warn("Default hyperparameter_bounds initialized because none were provided. "
array([1.51598478, 3.75613464, 1.25599089])
print("Data as seen by fvgp:")
print(my_gp2.fvgp_x_data)
print(my_gp2.fvgp_y_data)

print("Transformed data for the GP:")
print(my_gp2.x_data)
print(my_gp2.y_data)
Data as seen by fvgp:
[[0.05357886]
 [0.34483704]
 [0.11041418]
 [0.19913336]
 [0.99882966]
 [0.61642438]
 [0.52805075]
 [0.01828533]
 [0.32268135]
 [0.08848433]]
[[ 0.02050944 -1.01046914]
 [ 0.16336261 -1.08141453]
 [ 0.05378419 -1.01985271]
 [ 0.09734176 -1.04298105]
 [ 0.50206923 -1.25874266]
 [ 0.30666719 -1.14903059]
 [ 0.26611577 -1.13183672]
 [ 0.00347495 -1.00172675]
 [ 0.15357284 -1.08589763]
 [ 0.04890959 -1.03052618]]
Transformed data for the GP:
[[0.05357886 0.        ]
 [0.34483704 0.        ]
 [0.11041418 0.        ]
 [0.19913336 0.        ]
 [0.99882966 0.        ]
 [0.61642438 0.        ]
 [0.52805075 0.        ]
 [0.01828533 0.        ]
 [0.32268135 0.        ]
 [0.08848433 0.        ]
 [0.05357886 1.        ]
 [0.34483704 1.        ]
 [0.11041418 1.        ]
 [0.19913336 1.        ]
 [0.99882966 1.        ]
 [0.61642438 1.        ]
 [0.52805075 1.        ]
 [0.01828533 1.        ]
 [0.32268135 1.        ]
 [0.08848433 1.        ]]
[[ 0.02050944]
 [ 0.16336261]
 [ 0.05378419]
 [ 0.09734176]
 [ 0.50206923]
 [ 0.30666719]
 [ 0.26611577]
 [ 0.00347495]
 [ 0.15357284]
 [ 0.04890959]
 [-1.01046914]
 [-1.08141453]
 [-1.01985271]
 [-1.04298105]
 [-1.25874266]
 [-1.14903059]
 [-1.13183672]
 [-1.00172675]
 [-1.08589763]
 [-1.03052618]]
Predictions#
y_test = np.hstack([f1(x_pred1d).reshape(len(x_pred1d),1),f2(x_pred1d).reshape(len(x_pred1d),1)])
print("RMSE:              ", my_gp2.rmse(x_pred1d.reshape(len(x_pred1d),1),y_test))
print("NLPD:              ", my_gp2.nlpd(x_pred1d.reshape(len(x_pred1d),1),y_test))
print("R2:                ", my_gp2.r2(x_pred1d.reshape(len(x_pred1d),1),y_test))
print("CRPS (mean, std):  ", my_gp2.crps(x_pred1d.reshape(len(x_pred1d),1),y_test))
RMSE:               0.0038961433228176653
NLPD:               -3.7837658242534413
R2:                 0.9999687789675452
CRPS (mean, std):   (np.float64(0.0028568735959899143), np.float64(0.0015072105901665336))
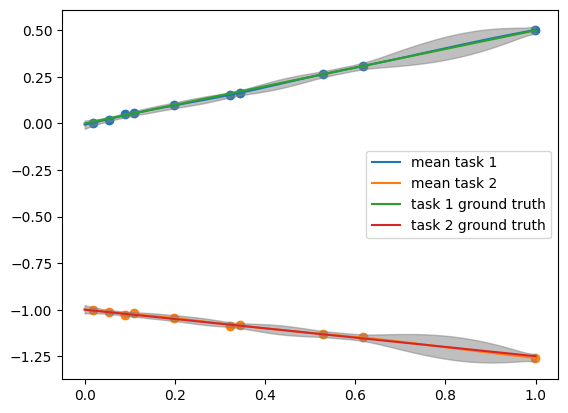
#mean and standard deviation
mean = my_gp2.posterior_mean(x_pred=x_pred1d.reshape(50,1))["m(x)"]
std = np.sqrt(my_gp2.posterior_covariance(x_pred=x_pred1d.reshape(50,1), x_out=np.array([0,1]))["v(x)"])


plt.plot(x_pred1d.reshape(50,1),mean[:,0], label = "mean task 1")
plt.plot(x_pred1d.reshape(50,1),mean[:,1], label = "mean task 2")
plt.scatter(x_data,y_data1)
plt.scatter(x_data,y_data2)
plt.plot(x_pred1d,f1(x_pred1d), label = "task 1 ground truth")
plt.plot(x_pred1d,f2(x_pred1d), label = "task 2 ground truth")
plt.fill_between(x_pred1d, mean[:,0] - 3. * std[:,0], mean[:,0] + 3. * std[:,0], alpha = 0.5, color = "grey")
plt.fill_between(x_pred1d, mean[:,1] - 3. * std[:,1], mean[:,1] + 3. * std[:,1], alpha = 0.5, color = "grey")
plt.legend()
plt.show()
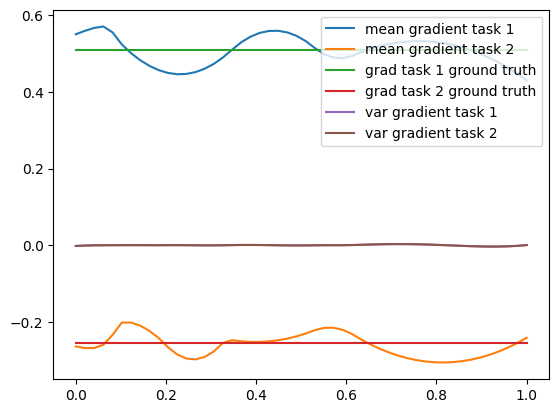
#mean gradient and variance gradient
mean_grad = my_gp2.posterior_mean_grad(x_pred=x_pred1d.reshape(50,1), x_out=np.array([0,1]))["dm/dx"]
var_grad = my_gp2.posterior_covariance_grad(x_pred=x_pred1d.reshape(50,1), x_out=np.array([0,1]))["dv/dx"]

plt.plot(x_pred1d.reshape(50,1),mean_grad[:,0,0], label = "mean gradient task 1")
plt.plot(x_pred1d.reshape(50,1),mean_grad[:,0,1], label = "mean gradient task 2")
plt.plot(x_pred1d,np.gradient(f1(x_pred1d), 1./50.), label = "grad task 1 ground truth")
plt.plot(x_pred1d,np.gradient(f2(x_pred1d), 1./50.), label = "grad task 2 ground truth")
plt.plot(x_pred1d.reshape(50,1),var_grad[:,0,0], label = "var gradient task 1")
plt.plot(x_pred1d.reshape(50,1),var_grad[:,0,1], label = "var gradient task 2")
plt.legend()
plt.show()
What if some tasks are missing from the data#
It works just fine, but we have to insert np.nan at positions of missing data, both for y and the variances.#
y_data = np.column_stack([y_data1, y_data2])
noise_variances = np.zeros(y_data.shape) + 0.01
y_data[2,0] = np.nan
noise_variances[2,0] = np.nan

y_data[6,1] = np.nan
noise_variances[6,1] = np.nan

my_gp2 = fvGP(x_data.reshape(len(x_data),1), y_data, noise_variances=noise_variances)
print("Global Training in progress")
my_gp2.train(max_iter = 20)
Global Training in progress
array([1.48660502, 3.70024342, 1.7449458 ])
3d Example#
Data#
data = np.load("./data/sim_variable_mod.npy")
sparsification = 4

x_data3 = data[:,5:][::sparsification]
y_data3 = data[:,0:2][::sparsification]

#it is good practice to check the format of the data
print(x_data3.shape)
print(y_data3.shape)
(1583, 3)
(1583, 2)
index = np.where(x_data3[:,2] == 1200.)[0]
x_data3=x_data3[index,0:2]
y_data3=y_data3[index]

for i in range(x_data3.shape[1]):
    x_data3[:,i] = x_data3[:,i] - np.min(x_data3[:,i])
    x_data3[:,i] = x_data3[:,i] / np.max(x_data3[:,i])
x = np.linspace(0,1,100)
y = np.linspace(0,1,100)
x_pred3D = np.asarray(list(product(x, y)))
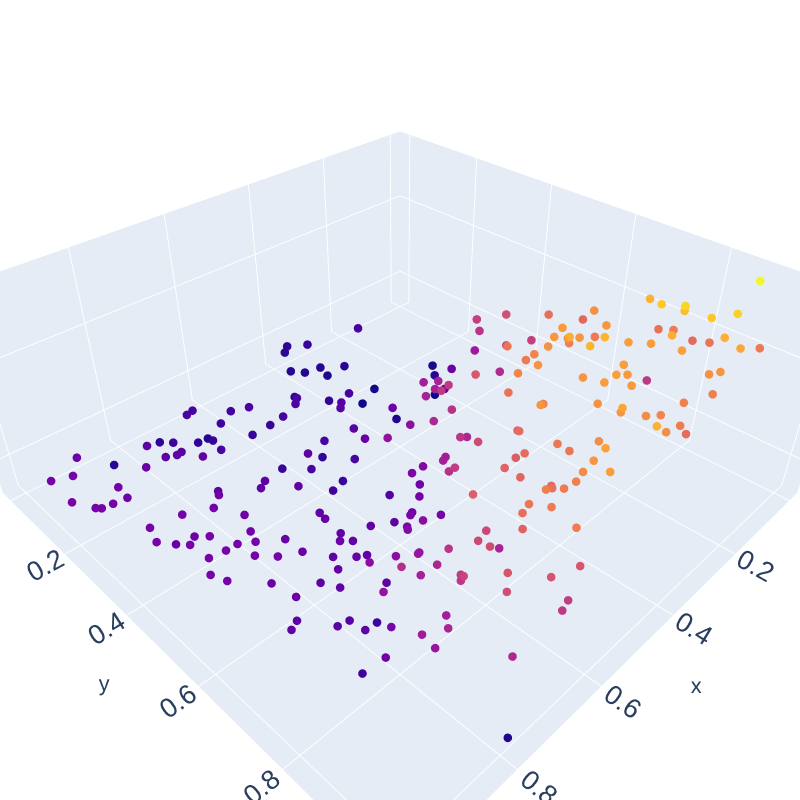
def scatter(x,y,z,size=3, color = 1):
    #if not color: color = z
    fig = go.Figure()
    fig.add_trace(go.Scatter3d(x=x, y=y, z=z,mode='markers',marker=dict(color=color, size = size)))


    fig.update_layout(autosize=False,
                  width=800, height=800,
                  font=dict(size=18,),
                  margin=dict(l=0, r=0, b=0, t=0))
    fig.show()
scatter(x_data3[:,0],x_data3[:,1],y_data3[:,0], size = 5, color = y_data3[:,0])
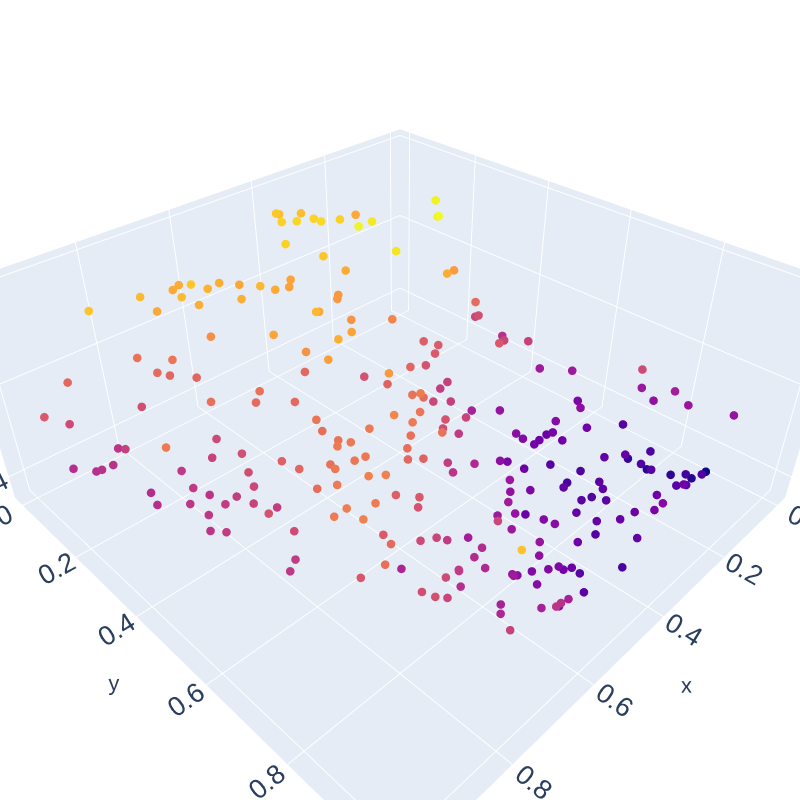
scatter(x_data3[:,0],x_data3[:,1],y_data3[:,1], size = 5, color = y_data3[:,1])
Initialization#
(a) Default behavior — minimal#
from fvgp import fvGP

my_gp2 = fvGP(x_data3,y_data3)
print("Global Training in progress")
my_gp2.train(max_iter = 2)
Global Training in progress
/home/marcus/Coding/fvGP/fvgp/gp.py:303: UserWarning: Hyperparameters initialized to a vector of ones.
  warnings.warn("Hyperparameters initialized to a vector of ones.")
/home/marcus/Coding/fvGP/fvgp/gp.py:337: UserWarning: No noise function or measurement noise provided. Noise variances will be set to (0.01 * mean(|y_data|))^2.
  self.likelihood = GPlikelihood(self.data,
/home/marcus/Coding/fvGP/fvgp/gp.py:665: UserWarning: Default hyperparameter_bounds initialized because none were provided. This will fail for custom kernel, mean, or noise functions
  warnings.warn("Default hyperparameter_bounds initialized because none were provided. "
array([0.27822969, 9.23905831, 3.33024481, 9.67536805])
(b) Custom kernel#
It is vital in the multi-task case to think hard about kernel design. The kernel is now a function over X x X x T x T, where X is the input and T is the output space. Print the input of the kernel, it will have the dimensionality of this cartesian product space. The default kernel in fvgp is just a Matern kernel operating in this new space.
#A simple kernel that won't lead to good performance because it's stationary
from fvgp.kernels import *
def mkernel(x1,x2,hps):
    d = get_distance_matrix(x1,x2)
    return hps[0] * matern_kernel_diff1(d,hps[1])
my_gp2 = fvGP(x_data3,y_data3,
              init_hyperparameters=np.ones((2)), kernel_function=mkernel
             )
print("MCMC Training in progress")


bounds = np.array([[0.01,1.],[0.01,1.]])
my_gp2.train(hyperparameter_bounds=bounds,max_iter = 20)
MCMC Training in progress
array([0.91299536, 0.74452358])
(c) A custom deep kernel#
from fvgp.deep_kernel_network import *
iset_dim = 3
gp_deep_kernel_layer_width = 5
n = Network(iset_dim, gp_deep_kernel_layer_width)
print(n.number_of_hps)

def deep_multi_task_kernel(x1, x2, hps):  # pragma: no cover
    signal_var = hps[0]
    length_scale = hps[1]
    hps_nn = hps[2:]
    w1_indices = np.arange(0, gp_deep_kernel_layer_width * iset_dim)
    last = gp_deep_kernel_layer_width * iset_dim
    w2_indices = np.arange(last, last + gp_deep_kernel_layer_width ** 2)
    last = last + gp_deep_kernel_layer_width ** 2
    w3_indices = np.arange(last, last + gp_deep_kernel_layer_width * iset_dim)
    last = last + gp_deep_kernel_layer_width * iset_dim
    b1_indices = np.arange(last, last + gp_deep_kernel_layer_width)
    last = last + gp_deep_kernel_layer_width
    b2_indices = np.arange(last, last + gp_deep_kernel_layer_width)
    last = last + gp_deep_kernel_layer_width
    b3_indices = np.arange(last, last + iset_dim)

    n.set_weights(hps_nn[w1_indices].reshape(gp_deep_kernel_layer_width, iset_dim),
                  hps_nn[w2_indices].reshape(gp_deep_kernel_layer_width, gp_deep_kernel_layer_width),
                  hps_nn[w3_indices].reshape(iset_dim, gp_deep_kernel_layer_width))
    n.set_biases(hps_nn[b1_indices].reshape(gp_deep_kernel_layer_width),
                 hps_nn[b2_indices].reshape(gp_deep_kernel_layer_width),
                 hps_nn[b3_indices].reshape(iset_dim))
    x1_nn = n.forward(x1)
    x2_nn = n.forward(x2)
    d = get_distance_matrix(x1_nn, x2_nn)
    k = signal_var * matern_kernel_diff1(d, length_scale)
    return k


my_gp2 = fvGP(x_data3,y_data3,
              init_hyperparameters=np.ones((n.number_of_hps+2))*0.1, kernel_function=deep_multi_task_kernel
             )

print("MCMC Training in progress")
bounds = np.zeros((n.number_of_hps+2,2))
bounds[0] = np.array([0.01,1.])
bounds[1] = np.array([0.1,1.])
bounds[2:] = np.array([-1,1])
my_gp2.train(hyperparameter_bounds=bounds,max_iter = 1000, method = "mcmc")
68
MCMC Training in progress
/home/marcus/Coding/fvGP/fvgp/gp.py:337: UserWarning: No noise function or measurement noise provided. Noise variances will be set to (0.01 * mean(|y_data|))^2.
  self.likelihood = GPlikelihood(self.data,
array([ 0.37411992,  0.14951496, -0.72963725, -0.18888054,  0.67213749,
       -0.07515285,  0.07306267, -0.19574837,  0.19353265,  0.08473451,
       -0.53280032,  0.31736742, -0.60024183, -0.17611588,  0.39143046,
        0.11019832, -0.57560578,  0.52764492,  0.53704992, -0.67332382,
       -0.2598724 ,  0.12675059,  0.02060387,  0.56011095,  0.2427266 ,
        0.19372845,  0.53306509,  0.1031496 ,  0.62768122,  0.22677681,
       -0.56076272,  0.61285793,  0.99672799,  0.03412346,  0.51722056,
       -0.59706579,  0.10859733, -0.75962512, -0.37891372,  0.66415899,
       -0.12443707,  0.034276  ,  0.33958454, -0.06908845, -0.29916646,
        0.31974888, -0.46370433,  0.333398  , -0.60167651, -0.69966905,
        0.46772074,  0.30971595,  0.20664456,  0.27906239,  0.55789336,
        0.32158142, -0.80179549,  0.26412239, -0.16496403, -0.59144575,
        0.8129776 ,  0.19104543,  0.44896872, -0.1689607 ,  0.5678231 ,
        0.95021458, -0.15692003, -0.5856414 ,  0.15122801,  0.87712074])
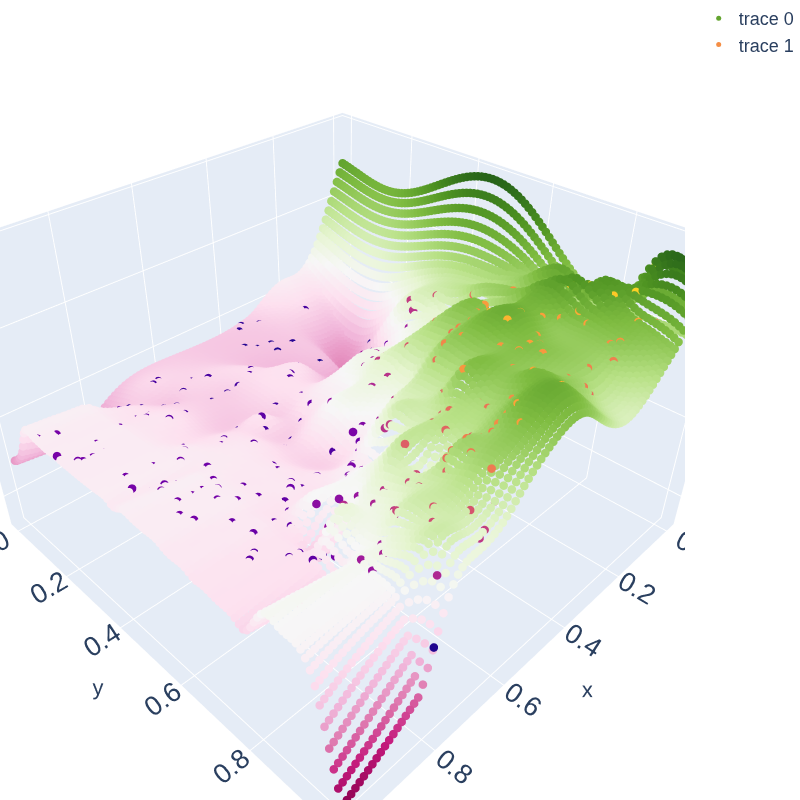
Prediction#
mean = my_gp2.posterior_mean(x_pred3D)["m(x)"]
var =  my_gp2.posterior_covariance(x_pred3D)["v(x)"]
fig = go.Figure()
fig.add_trace(go.Scatter3d(x=x_pred3D[:,0],y=x_pred3D[:,1], z=mean[:,0],
mode='markers',marker=dict(color=mean[:,0], size = 5)))
fig.add_trace(go.Scatter3d(x=x_data3[:,0], y=x_data3[:,1] , z=y_data3[:,0],
mode='markers',marker=dict(color=y_data3[:,0], size = 5)))
fig.update_layout(autosize=False,
width=800, height=800,
font=dict(size=18,),
margin=dict(l=0, r=0, b=0, t=0))
fig.show()
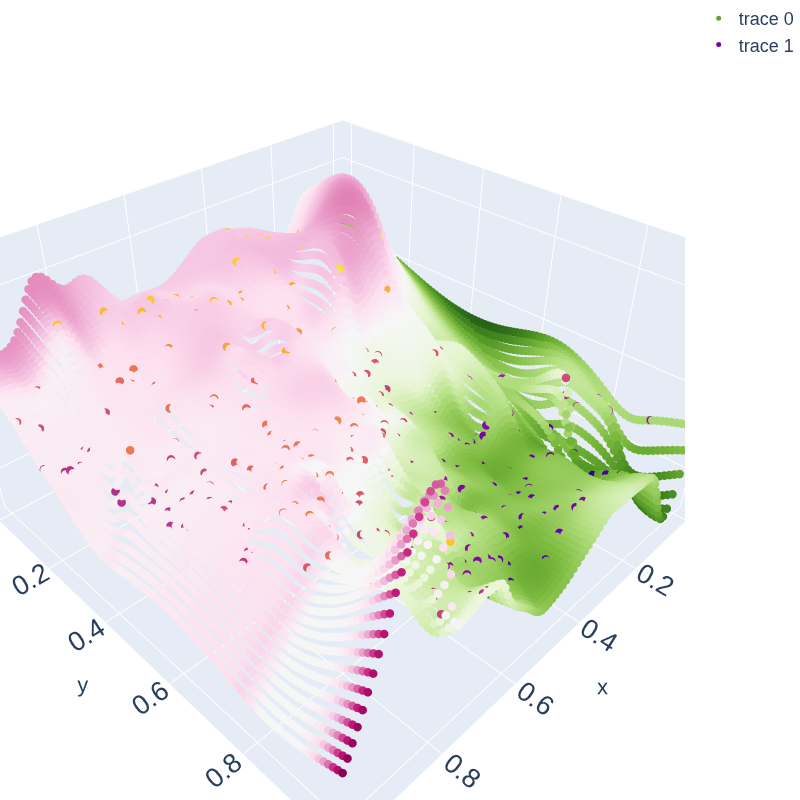
fig = go.Figure()
fig.add_trace(go.Scatter3d(x=x_pred3D[:,0],y=x_pred3D[:,1], z=mean[:,1],
mode='markers',marker=dict(color=mean[:,0], size = 5)))
fig.add_trace(go.Scatter3d(x=x_data3[:,0], y=x_data3[:,1] , z=y_data3[:,1],
mode='markers',marker=dict(color=y_data3[:,1], size = 5)))
fig.update_layout(autosize=False,
width=800, height=800,
font=dict(size=18,),
margin=dict(l=0, r=0, b=0, t=0))
fig.show()